


Paycor Smart Sourcing
Increase Your Pipeline with Just a Few Clicks
All great talent deserves to shine. Paycor’s industry-leading AI diversity solution levels the playing field for all talent regardless of race, gender, age, identity or disability.
Find & Engage Top Talent with AI
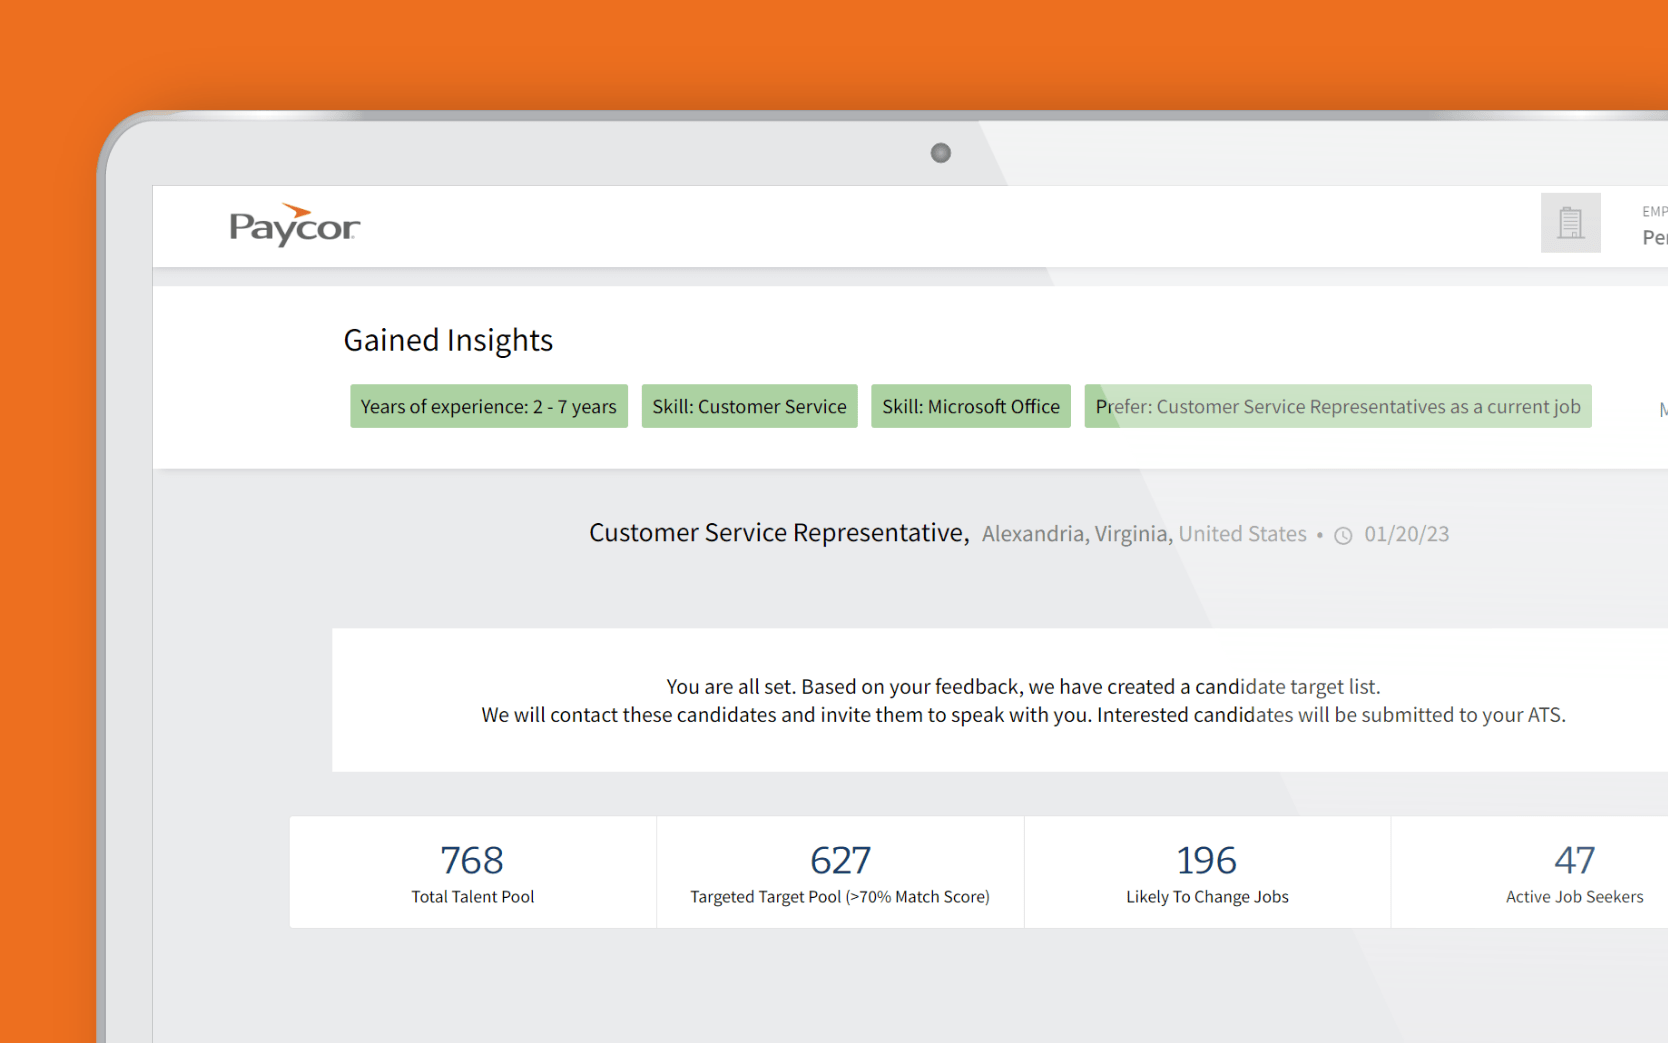
Paycor Smart Sourcing works like a Virtual Sourcing Assistant. It taps into job boards and databases to find and contact the best candidates for every role. For active job seekers, it posts jobs on thousands of job sites, and campaigns them programmatically, so you can optimize exposure and spend. Paycor Smart Sourcing is your one-stop-shop for all sourcing. It works automatically to take your hiring to a new level of efficiency and quality.
4.3/5 (45 Reviews)
Attract Qualified & Diverse Talent + Reduce Manual Effort
Paycor Smart Sourcing reduces time-to-hire by sourcing candidates who are actively looking to change jobs and passive candidates who might not even be in the market, as well as diverse candidates that may be ideal for the role but overlooked by traditional systems.
Uncover Candidates Other Tools Miss —
Eliminate tedious keyword search with AI technology that automatically curates a prioritized list of candidates for every role.
Increase Interview Pipeline —
Increase candidate response and engagement by automatically connecting with hundreds of candidates per role using AI-powered campaigns.
Save Time & Money —
Reduce time and cost per hire with technology that automates sourcing and lets your recruiters focus on interviews.

Find More Diverse Candidates—
Use AI to identify diverse talent and boost their participation in the hiring pipeline, without offering preferential treatment.
Paycor Empowers Leaders with Ethical AI.
Curious about Paycor’s approach to artificial intelligence?
FAQs
Existing Paycor Smart Sourcing (formerly Talenya) customers that do not have payroll, HR, or the full HCM suite of Paycor can log into the Paycor Smart Sourcing product application at https://www.talenyanetwork.com/#/login/.
Paycor Smart Sourcing clients are typically enterprises with significant hiring needs. In addition, companies looking to increase their diversity hiring will find Paycor Smart Sourcing Diversity AI an unparalleled diversity sourcing solution–3X more qualified and diverse talent in the pipeline without any preferential treatment.
Paycor Smart Sourcing recommends specific changes to job requirements that are likely to increase diverse talent participation in recruiting pipelines. In seconds, AI creates many slightly altered versions of your current job requirements, landing on the version that will most likely deliver the most diverse and inclusive pipeline for your role.
Paycor Smart Sourcing automates each step of the sourcing process. There are tools that expand your search, tools that help you engage with candidates, and tools that let you filter candidates by diversity, but Paycor Smart Sourcing performs all of these functions in a single platform and optimizes each of them automatically. With Paycor Smart Sourcing, recruiters don’t need to train on a new tool. New candidates flow directly into your recruiting platform within hours.
Paycor Smart Sourcing can improve the work of human recruiters and free them up to work on more jobs. Paycor Smart Sourcing can be compared to a “virtual sourcer”, using AI to generate more interviews for the recruiters with little or no work. ROI on the Paycor Smart Sourcing platform can be as short as 4 months.
The first interviews can be delivered even within a few hours from starting a campaign. Typically interviews start coming in within a day or two.
We recommend starting your search with Paycor Smart Sourcing, rather than using it only when your manual search runs dry. You should be able to get interested candidates in your recruiting solution or ATS very quickly.
Paycor customers that utilize both Paycor Smart Sourcing and Paycor Recruiting will enjoy a seamless and secure experience. For customers that choose Paycor Smart Sourcing as a standalone option, the tool is fully integrated with all major ATS and CRM to also provide a seamless and secure recruitment experience. Job descriptions are retrieved from the ATS, candidates already in process with the company are de-duplicated, and interested candidates are pushed back to the ATS for follow-up.
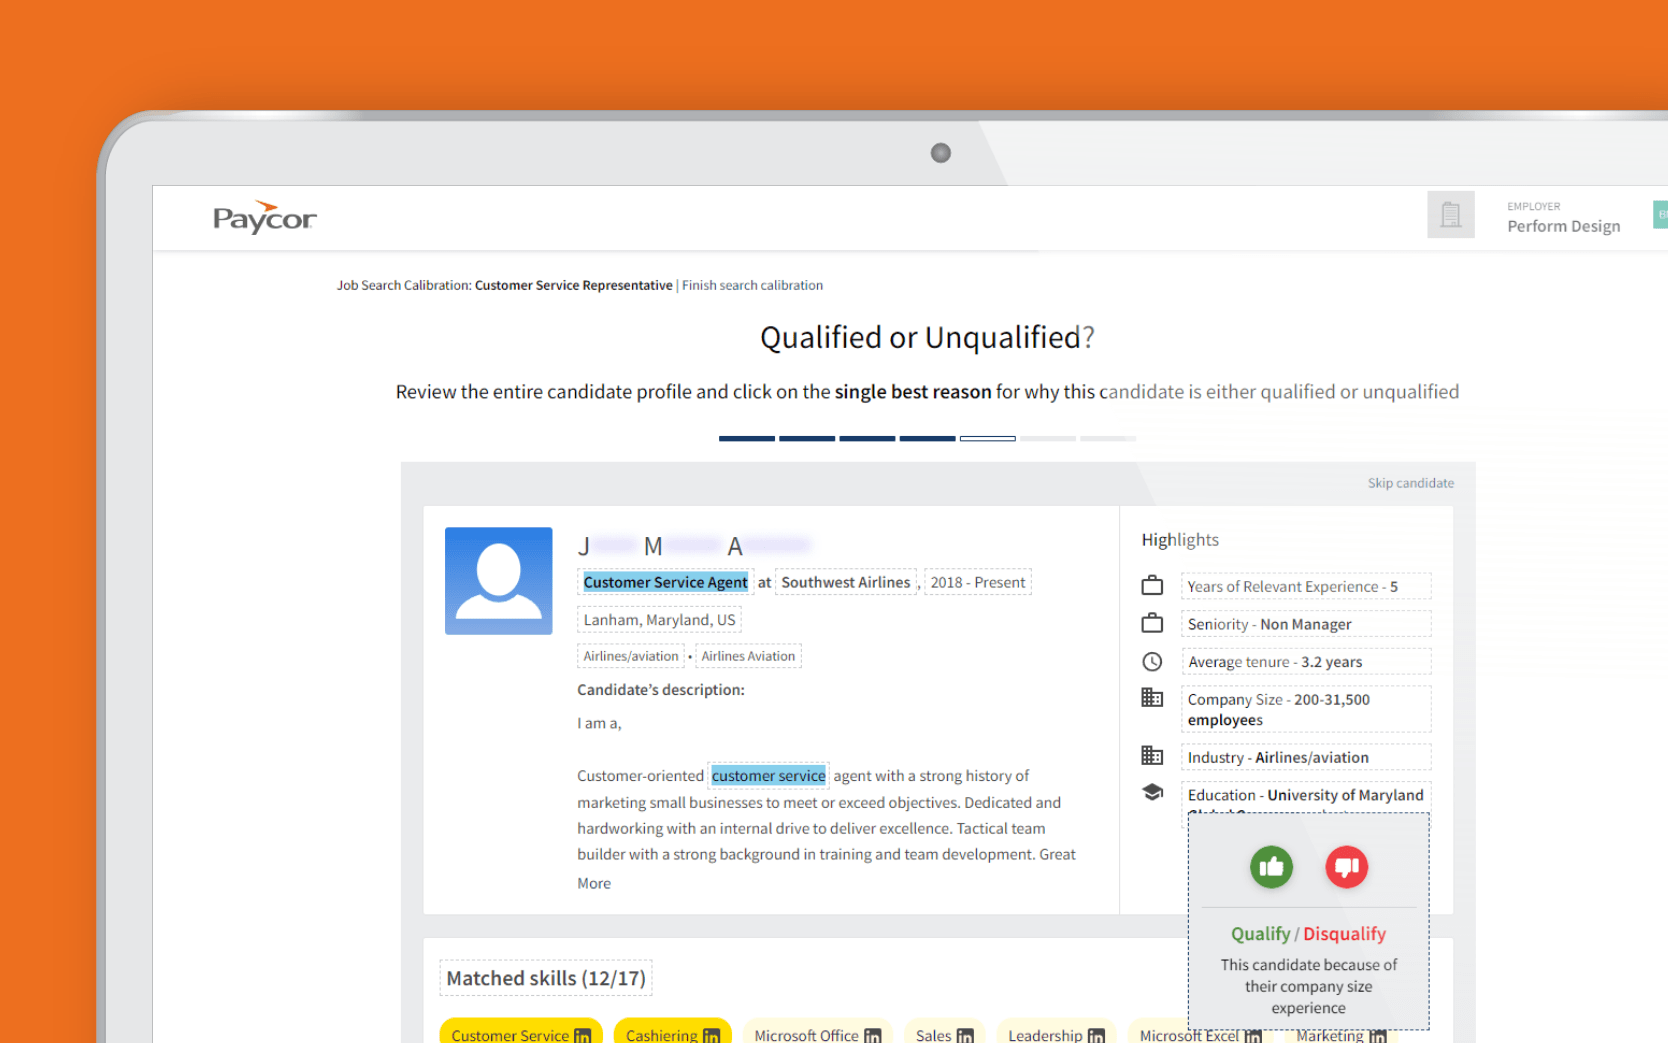
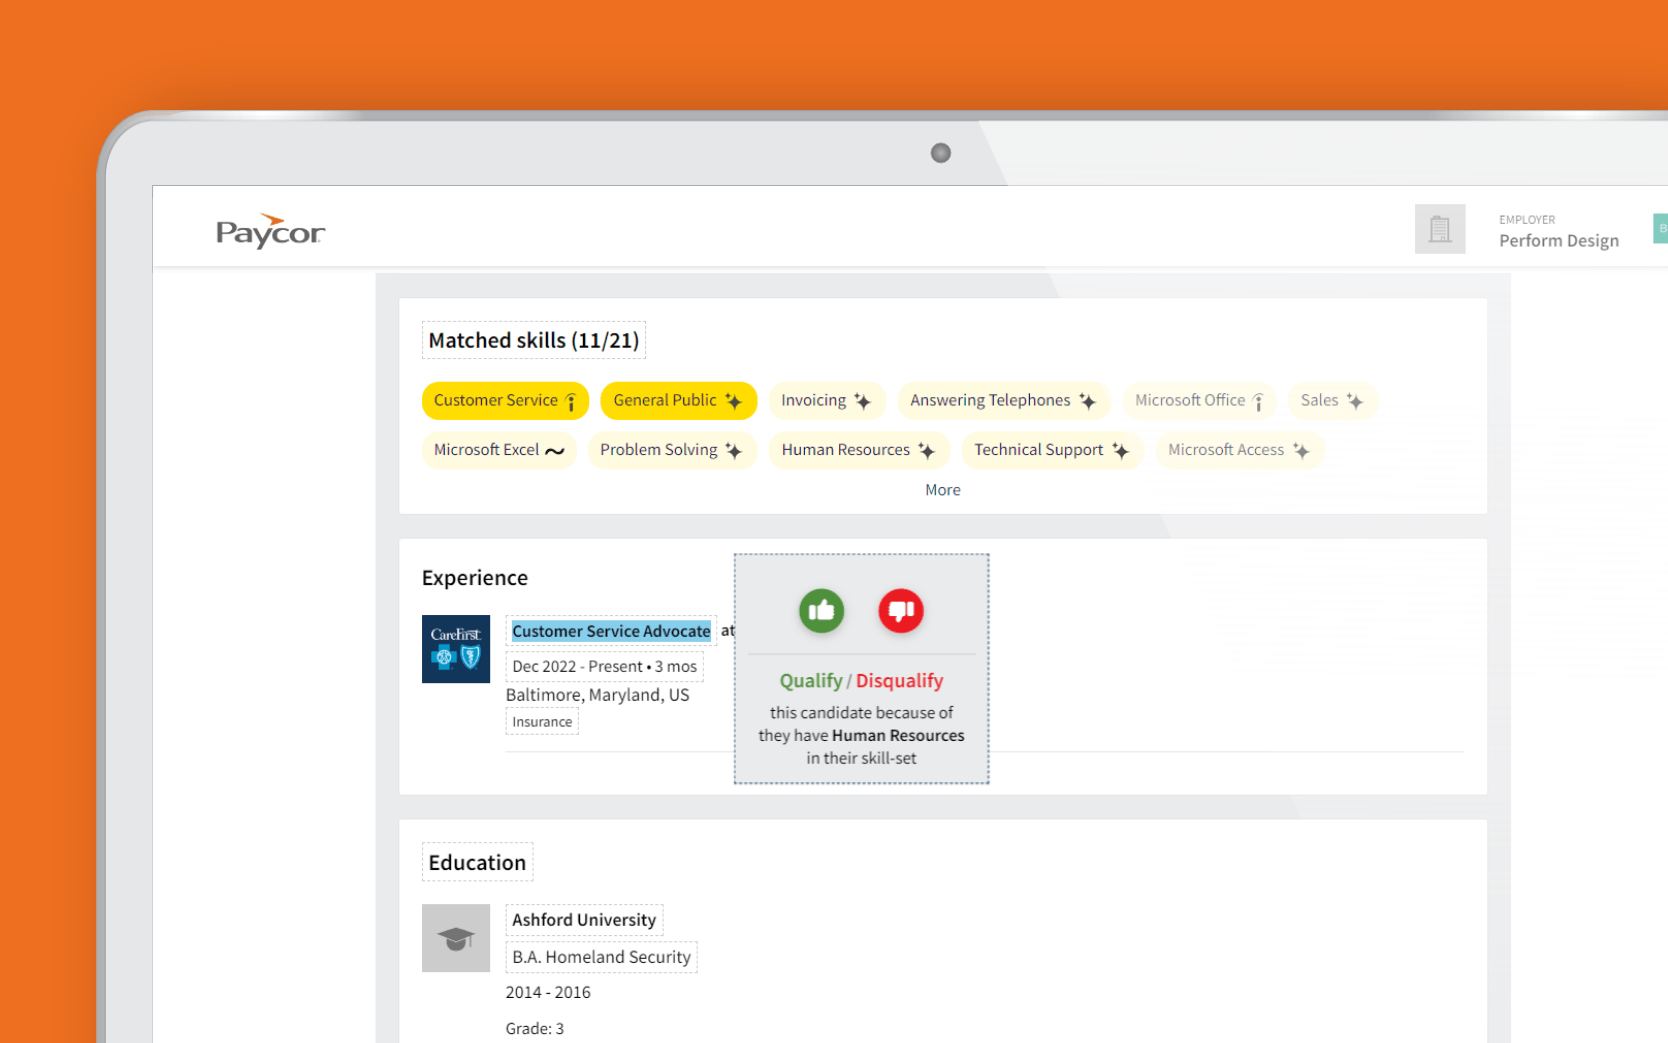
In addition to a job description, Paycor Smart Sourcing uses your feedback (thumbs up and down) on 7 profiles, to further refine your search. Once a prioritized list is created, a personalized and optimized drip campaign is launched for every job, using multiple channels such as e-mail and social networks. Messages are sent to hundreds of candidates per job to maximize the chances of a response.
Discover How Much You Can Save
Calculate your potential savings with our ROI Calculator. Simply input your current recruiting costs and compare them with the costs of Paycor Smart Sourcing. .
Awards & Recognition


“There is no other platform out there that will enable you to find the type of diversity per function the way that Paycor Smart Sourcing does. The way that it aggregates the data and then remembers what you do, it really saves time.”
– Silverlee Hernandez
Sr. Manager of Talent Acquisition, J.Crew

Resources
Get the expert advice and thought leadership you need to help your clients solve their toughest business challenges.
Article
Read Time: 10 min
5 Reasons Why You Shouldn’t Ignore AI Recruiting Technology
Don’t fall behind the times by failing to embrace new technologies. Here are 5 ways avoiding AI recruitment technology can hurt your recruitment game.
Guides + White Papers
Read Time: 1 min
AI Recruitment Technology: How to Build a Case with ROI
Get tips on how to gain buy-in from executives and overcoming common barriers to adoption.
Guides + White Papers
Read Time: 1 min
How AI Technology Transforms Recruiting & Hiring
Discover how to achieve hiring goals faster and more efficiently with AI recruitment technology.
Guides + White Papers
Read Time: 1 min
How to Increase Diversity in Your Workforce Through AI Technology
Achieve your diversity hiring goals faster and more efficiently with smart strategies, proper training, and the latest AI technologies.